NemSight
Asia-Pacific
Analytics, Contract & Portfolio Management, Physical & Financial Trading

NemSight is a real-time presentation and historical market analysis tool for the Australian electricity, gas and renewables markets.
NemSight is a Windows-based platform that displays information including live prices, demand, constraints, generation, bidstacks and temperatures.
NemSight also provides alerts for spot prices, generation, availability, interconnector and constraint binding and includes historical analysis functionality. Users can create and save dashboards to provide customised combined data feeds.
Live content
- Live prices – for all markets and regions including user-configurable alerting
- Live generation – for all regions and generation units and statistics aggregated by a wide array of factors
- Live network diagrams – presenting generation, outages and constraints in an easy-to-use format
- Live gas network overview – presents gas bulletin board data such as forecast and actual flows
Statistical overviews
- Time Machine – historical data analysis and extraction tool covering Electricity (incl FCAS pricing), Gas, Rooftop PV and Weather
- Regional statistics – offers a range of statistics based on spot price, regional or interconnector volumes to be time-bucketed by peak or off-peak schedules, profiles, distributions and duration curves
Information at your fingertips
- Rooftop PV – provision of forecast rooftop PV generation data, presented in a graphical form and in Time Machine
- Gas bidstacks – for STTM and VicGas
- Generator re-bidding – examines bidstacks for all energy and ancillary markets
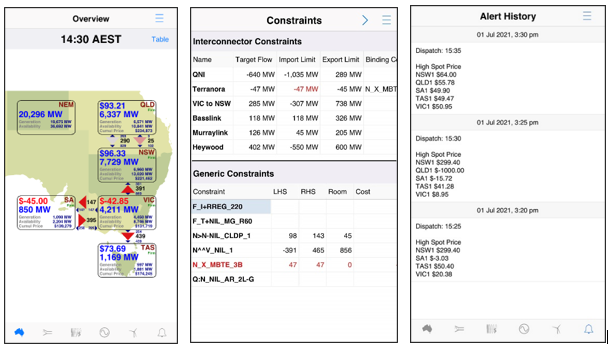
- NemSight Mobile – Android and iOS application providing live access to key NEM (Electricity) data
Discover the benefits of NemSight
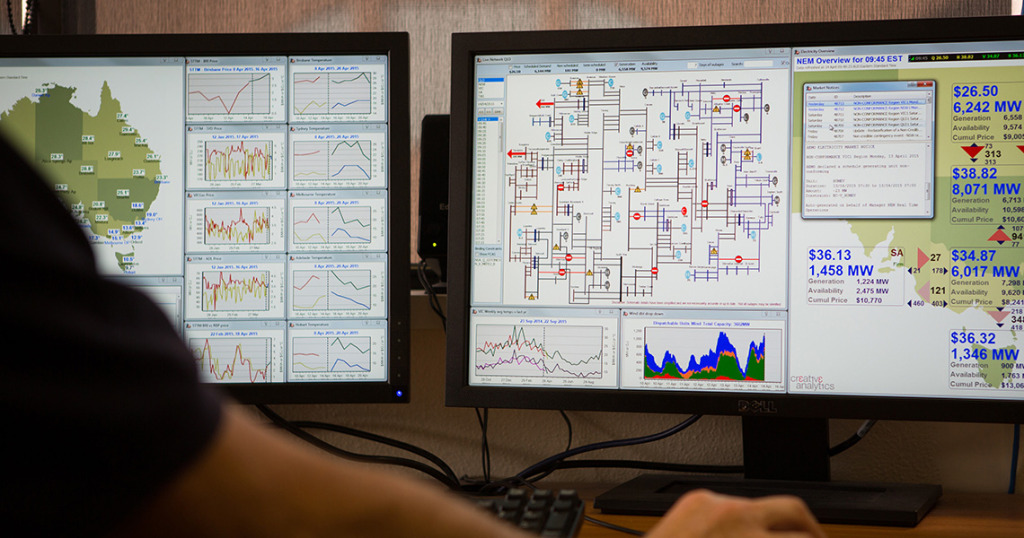
NemSight’s start-up screen is the price bar. This sits at the top of your screen and displays the current spot price in each region, changing colour if alert or alarm levels are exceeded. The “reception” graph indicates the connection speed and the menu on the right-hand side provides access to NemSight’s rich suite of analytical and presentation functionality. Moving your mouse over the prices displays a chart showing spot prices for today including pre-dispatch. The Live Maps display a range of electricity, gas and temperature variables in a scalable form for display on your “big screen”. It also provides a launching pad for a variety of live charts via right-click menus. The Reports menu assembles a collection of screens including an alarms list, market notices, 5 minute pre-dispatch prices, month-to-date and quarter-to-date price averages, and finally dam levels. The Live Gas Overviews display the current price, supply and withdrawals for the STTM and VIC gas markets. The screens refresh throughout the day as new schedules become available.
The Live Generation presents the current state of the generators across the NEM. It highlights generators starting, stopping and those units which have changed their output since the last dispatch interval. The fuel-type of each generator is highlighted and clicking a unit launches the Time Machine window for the selected generator.
The Network Diagrams present generation, outages and constraints in a simplified single line diagram format. This presents data for the current dispatch period or a historical dispatch period. Generators in grey are not currently generating whilst generators in blue are. Based on the binding constraints in the selected dispatch interval, generators coloured red are constrained off and in green are constrained on. Moving your mouse over a generator displays its name, the loss-adjusted spot price, generation at each unit, its capacity, and the degree to which it is constrained on or off. Planned future line outages are indicated with a yellow attention sign and a red line-closed sign for current outages. Again moving the mouse over the icon displays further information.
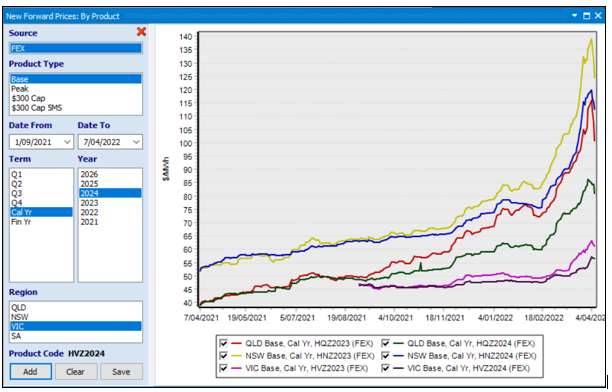
The Live Charts offer a rich set of variables to be charted including dispatch, pre-dispatch, price sensitivities, PASA, FCAS and constraints. The charts are updated in a live fashion as new data becomes available. A chart definition may be saved and re-created later from the Saved Charts menu. In fact your entire live layout may be set out and saved so that it is created upon starting NemSight.
NemSight’s Time Machine amalgamates a range of electricity, gas and weather data into one module. The electricity data includes regional and interconnector data, but also generation and associated bid stacks. The bid stacks are final energy bid stacks, and can be explored in more detail in the Re-bidding module. The data may be presented in half-hourly resolution or aggregated by day, week, month or quarter. With an overlay, the values may also be compared to the previous day, week, month, quarter or year. While the data is predominately historical, the Time Machine includes pre-dispatch and PASA values for supported data sets.
NemSight’s Re-bidding module examines generator bid stacks for a single day exploring bid versions, supporting the energy market and all eight ancillary services markets. All data is presented in five-minute resolution and includes bid stacks, spot price, dispatch target, and initial generation. Price setters and binding constraints are also provided noting that there are often many price setters per dispatch interval. The supply stack (a price-ordered list of bids) can be calculated for a selected dispatch interval presenting the dispatched quantity from each bid.
NemSight’s Gas Bids module presents gas bid stacks for the STTM or VIC gas market across a number of days. Similar to the electricity bid stack analysis, the bid can be aggregated by participant or facility, both supply (injections) and demand (withdrawals) bid stacks can be explored.
NemSight’s Regional Statistics offers a range of calculations based on spot price, regional or interconnector volumes which can then be time-bucketed by peak/off-peak schedules, 48-part profiles for working or non-working days, distributions or duration curves. Calculations include common statistical metrics of average, minimum, maximum and standard deviation and the market-specific $300 Cap payoff.
NemSight’s Generation Statistics offers a range of calculations based on generator dispatch which can then be aggregated by power station, participant, region or fuel-type. Calculations include Availability Factor, Capacity Factor, Carbon Emissions, Fuel consumption (for thermal plants based on estimated thermal efficiency), Pool sales and Dispatch-weighted Spot Price.
NemSight’s Constraints module presents historical, current and future binding constraints. Constraints to be invoked due to planned network outages are displayed for further inspection. Constraints currently binding or near-binding are displayed for today including 5-minute and 30-minute pre-dispatch. The historical analysis calculates how often each constraint binds and spot price statistics during those binding intervals.
NemSight’s PASA Delta presents changes in PASA Availability in the weekly or three-hourly PASA files published by AEMO. The weekly option also includes changes in the system demand forecasts.
A key part of our development process is automated testing. We currently run in excess of 600 tests on NemSight each night on multiple platforms to ensure the quality of our software.
Related solutions
-
EOT
EOT is a front, middle and back office solution for energy commodities for Australia, New Zealand and Asia.
View software
-
EnergyOffer
EnergyOffer is a bidding, offering, dispatch and logistics solution for all Australian energy markets.
View software
-
SimEnergy
SimEnergy is Australasia’s most popular packaged ETRM solution, offering deal capture, settlements and risk capability.
View software
-
pypIT
pypIT is Australia’s leading gas pipeline contracts management and scheduling platform.
View software
-
enFlow
enFlow is a tool for automating and managing business processes and for integrating systems.
View software
-
Managed Services
With all products available in the cloud as Software as a Service (SaaS), Energy One can provide full management of your system needs.
View service